![]()
![]()
![]()
![]()
![]()
![]()

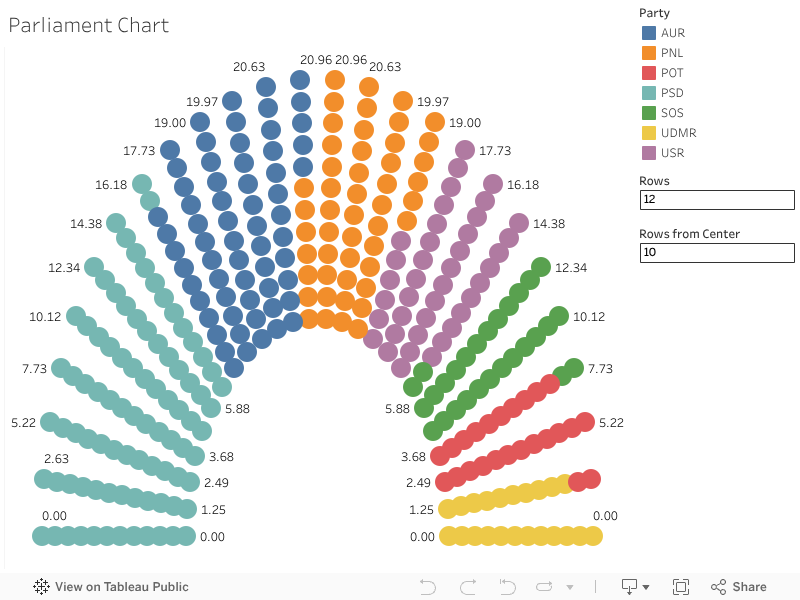
In this Skillpill, you will learn how to create a Parliament Chart in Tableau.
A Parliament Chart, or semicircular chart, represents the distribution of parliamentary seats. It is not a standard chart type in Tableau but can be manually created using calculations and customizations.
This type of chart is ideal for visualizing proportional distributions, such as parliamentary seats, votes, or other categories, in a way that is engaging and appealing.
→ Start by preparing your data and ensure it’s in a format that includes, in this case: the party and the number of seats occupied by each

How to Retrieve and Process JSON Data from a REST API in Talend Are you working as a Data Engineer, and have you started using Talend? Maybe in one of your projects, you need to retrieve data from a REST […]

💡 Unlock the Power of Tableau for Smarter Data Decisions Are you ready to transform the way you see and use data? Tableau is more than just a data visualisation tool, it’s your gateway to interactive, intuitive, and impactful business […]

You are working at a Data Analytics company, and in one of your projects, you need to load data from a source into a target table using Talend. However, while running the Talend Job, the data will fail to load […]