![]()
![]()
![]()
![]()
![]()
![]()

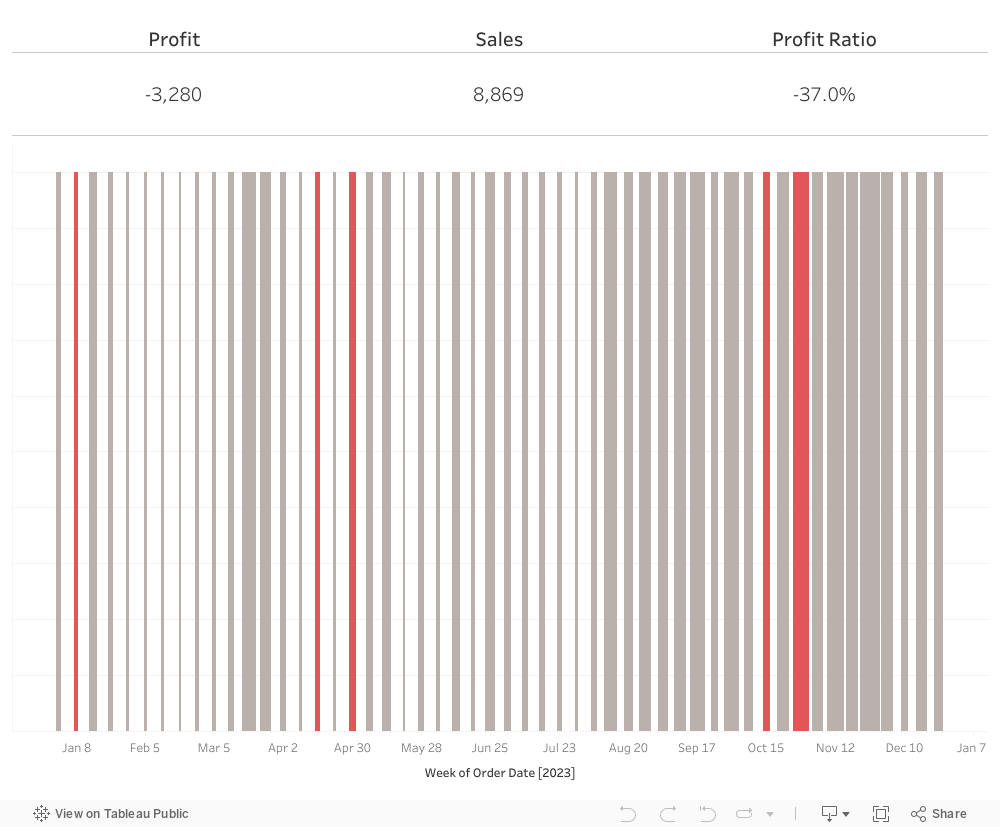
Discover the power of Tableau’s Barcode Chart – a sleek and intuitive visualization tool that seamlessly combines profitability and sales size analysis over time.
This dynamic chart ingeniously merges two metrics, offering a concise yet powerful glimpse into your business’s financial landscape. You can effortlessly decode peaks and challenges, guided by vibrant color cues, and dive into each bar’s height to evaluate sales magnitude.
Tableau’s Barcode Chart is more than just a graph; it’s your strategic ally that transforms data into actionable insights for informed decision-making.
Elevate your analytics game with this concise yet impactful visualization masterpiece. Here’s a simple guide on how to do it:
→ InTableau Desktop, connect to the provided Superstore sample data provided by Tableau
→ Drag the Order Date on the Column
→ Change the date type to Week Number
→ Create a calculated field with the formula SUM ([Profit])> 0
→ Drag this field to Color
→ Change colors, True -> Gray, False -> Red
→ Fit to Entire View
→ Filter the information for one year
→ On Raw, create an AVG (0.5)
→ Drag Sales to Size
→ From Marks, change the chart type from Automatic to Bar
→ If the space in the lines is not visible, decrease the size
Here is the dashboard in Tableau Public:
Watch the video tutorial here:
About btProvider:
We hold all possible technical and sales certifications for all products:
Tableau Desktop, Tableau Public, Tableau Server, Tableau Prep, and Tableau Data Management.
With Tableau Software – the best data visualization platform – you can always understand your business or your job better. Using Tableau, you will make intelligent and strategic decisions and quickly understand the data flow, numbers, and the results it produces. See other #skillpill video tutorials here:
How to display multiple insights on a dashboard in #Tableau
How to create Stacked Bars on Grand Totals in Tableau
How to create a Buffer Zoom in a Tableau Map
Are you interested in learning more about Tableau Software – one of the best analytics tools and implementing the solution in the entire company?
See how Tableau works, by downloading a free trial here:

How to Retrieve and Process JSON Data from a REST API in Talend Are you working as a Data Engineer, and have you started using Talend? Maybe in one of your projects, you need to retrieve data from a REST […]

💡 Unlock the Power of Tableau for Smarter Data Decisions Are you ready to transform the way you see and use data? Tableau is more than just a data visualisation tool, it’s your gateway to interactive, intuitive, and impactful business […]

You are working at a Data Analytics company, and in one of your projects, you need to load data from a source into a target table using Talend. However, while running the Talend Job, the data will fail to load […]