![]()
![]()
![]()
![]()
![]()
![]()

In Tableau, creating a Top N set can be achieved in various ways, and hierarchizing or filtering data to obtain the top N elements is quite accessible.
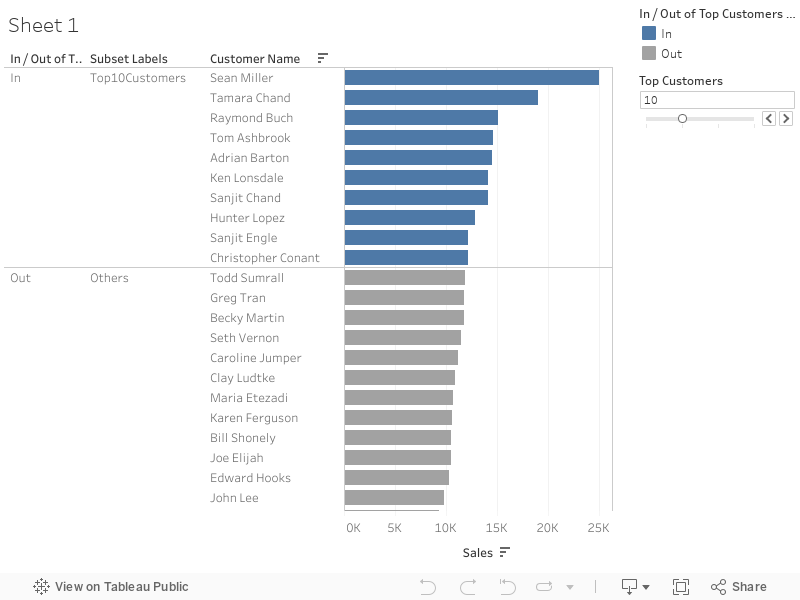
Creating a Top N set helps the end user craft an interactive visualization with a control that allows users to adjust the number of customers included in the desired group. Here’s a simple guide on how to do it:
→ InTableau Desktop, connect to the provided Superstore sample data by Tableau
→ Navigate to the “Data pane”.
→ Right-click and select “Create” -> “Parameter”.
→ Name the parameter “Top Customers”.
→ Set the “Data Type” to “Integer”.
→ Set the “Current value” to 5.
→ In the “Allowable values” section, select “Range”.
→ Set “Minimum” to 5, “Maximum” to 20, and “Step size” to 5.
→ Right-click on “Customer Name” in the “Data pane” and choose “Create” -> “Set”.
→ Name the set “Top N Customer by Sales”.
→ In the window that appears, select the “Top” tab.
→ Choose “By field” and select “Sales” from the “Category” list.
→ For “Aggregation,” choose “Sum” and click “OK.”
→ Go to the “Sets” area and drag “Top N Customers by Sales” to the “Rows” area.
→ From the “Dimension” area, move “Customer Name” to the “Rows” area.
→ From the “Measures” area, move “Sales” to the “Columns” area.
→ In the toolbar, click the “Sort Descending” button to arrange sales in descending order.
→ Right-click under “Sets” in the “Data pane” and choose “Create Calculated Field”.
→ Name the calculated field “Subset Labels” with the formula:
IF [Top N Customers by Sales]
THEN “Top ” + str([Top Customers]) + ” Customers”
ELSE “Others”
END
→ Add the calculated field “Subset Labels” to the “Rows” area between “Top N Customers Set” and “Customer Name”.
→ From the “Sets” area, drag “Top N Customers by Sales” to the “Marks” area, under “Color”.
→ Right-click on the set “Top N Customers by Sales” and select “Edit Set”.
→ Go to the “Top” tab and, in the “By field” section, choose “Top,” adding the “Top Customers” parameter from the list.
→ Right-click on the “Top Customers” parameter and select “Show Parameter Control”.
→ Now you can use the parameter control to adjust the “Top N” value and display the desired top customers.
Here is the dashboard in Tableau Public:
Watch the video tutorial here:
About btProvider:
We hold all possible technical and sales certifications for all products:
Tableau Desktop, Tableau Public, Tableau Server, Tableau Prep, and Tableau Data Management.
With Tableau Software – the best data visualization platform – you can always understand your business or your job better. Using Tableau, you will make intelligent and strategic decisions and quickly understand the data flow, numbers, and the results it produces. See other #skillpill video tutorials here:
How to display multiple insights on a dashboard in #Tableau
How to create Stacked Bars on Grand Totals in Tableau
How to create a Buffer Zoom in a Tableau Map
Are you interested in learning more about Tableau Software – one of the best analytics tools and implementing the solution in the entire company?
See how Tableau works, by downloading a free trial here:

How to Retrieve and Process JSON Data from a REST API in Talend Are you working as a Data Engineer, and have you started using Talend? Maybe in one of your projects, you need to retrieve data from a REST […]

💡 Unlock the Power of Tableau for Smarter Data Decisions Are you ready to transform the way you see and use data? Tableau is more than just a data visualisation tool, it’s your gateway to interactive, intuitive, and impactful business […]

You are working at a Data Analytics company, and in one of your projects, you need to load data from a source into a target table using Talend. However, while running the Talend Job, the data will fail to load […]