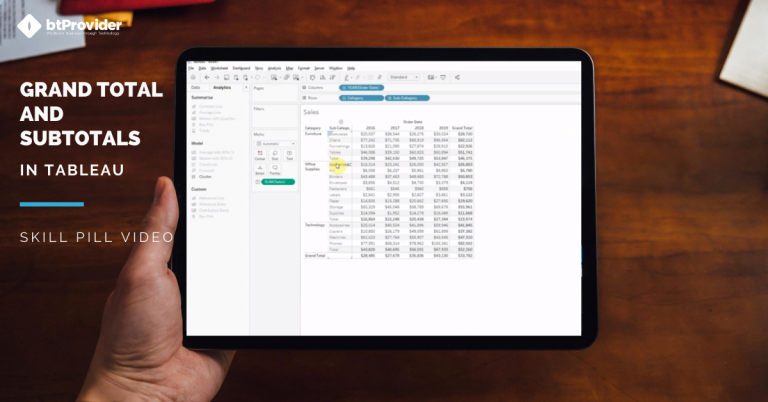
Data analysis helps us extract the information we need to make the right strategic decisions and to draw relevant conclusions about our actions. As always, we value our data and use the latest technologies for data processing and analysis. By using Tableau Software as a data analysis tool, we manage to increase our client’s performance and to optimize the business processes carried out within their companies.
Today we will discuss another method of analyzing business information, namely “Show Grand Total and Subtotals in a Table.” Retail, eCommerce, or Consumer Goods organizations face large volumes of information that hide important figures about goals and results. Often, these organizations need overviews in terms of profit distribution, sales, or expenses, depending on the product categories sold or the areas in which they operate.
In Tableau, the calculated total for all categories is called the Grand Total, while the calculated total at the category level is called the Subtotal. Remember that in order to use Grand Total in Tableau, the visualization must have at least one header. This means that it is mandatory to add a dimension on either Rows or Columns. However, the analyzed measures must be aggregated because their aggregation will determine the displayed total.
Grand Total and Subtotals allows end users to quickly calculate and view which is the total of one or more measures. For example, if we want to display the total sales received for each category of sold products, Grand Total and Subtotals feature calculates the values of this measure and displays their total amount in the graph.
Also, Grand Total and Subtotals calculates both total amount at category level, but also the total amount of all categories. Therefore, we can display in our chart the total sales of each product category that includes several subcategories, and the total sales for all product categories.
Grand Total and Subtotals applies to sum, average, minimum, maximum or percentage calculations. Next, we will build a view in which we will use Grand Total and Subtotals to calculate the sum of sales in our data set.
→ In Tableau Desktop, connect to Superstore sample data provided by Tableau.
→ Add Categories dimension into rows
→ Add Sub-Categories dimension into rows
→ Add Order Date dimension into columns
→ Add Sales into measures
→ Go to Analytics tab, click and drag Totals into the canvas and drop It onto one of the 3 (Subtotals, Row Totals, Column Totals)
→ If you want to select a different aggregation for the totals, click the Grand Total on either row or column, click Automated drop down and select the desired aggregation
→ If you want to remove a specific total go to Analysis -> Totals -> Click whichever Total you want to remove
By Andrei Stan

How to Retrieve and Process JSON Data from a REST API in Talend Are you working as a Data Engineer, and have you started using Talend? Maybe in one of your projects, you need to retrieve data from a REST […]

💡 Unlock the Power of Tableau for Smarter Data Decisions Are you ready to transform the way you see and use data? Tableau is more than just a data visualisation tool, it’s your gateway to interactive, intuitive, and impactful business […]

You are working at a Data Analytics company, and in one of your projects, you need to load data from a source into a target table using Talend. However, while running the Talend Job, the data will fail to load […]