![]()
![]()
![]()
![]()
![]()
![]()
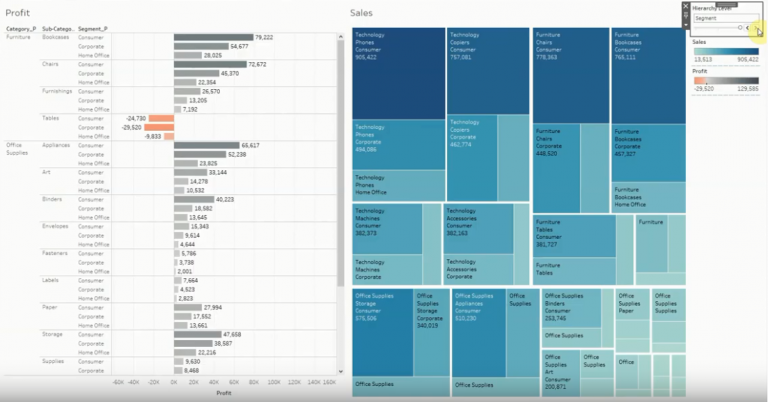
In Tableau when you say drilldown, hierarchies come to mind. Hierarchies are a great way for us to control the aggregation of a sheet. But when working in a Dashboard we sometimes want to expand hierarchies across multiple sheets. To achieve this we can use Parameters in Tableau to drive our level of aggregation. Watch btProvider video:
In order to expand a hierarchy across multiple sheets, using Parameters in Tableau, please follow these steps:
Step 1: Connect to data
Step 2: Create the Parameter and Calculated fields
Step 3: Create the Visualizations and Dashboard
By Alexandru Stancescu

How to Retrieve and Process JSON Data from a REST API in Talend Are you working as a Data Engineer, and have you started using Talend? Maybe in one of your projects, you need to retrieve data from a REST […]

💡 Unlock the Power of Tableau for Smarter Data Decisions Are you ready to transform the way you see and use data? Tableau is more than just a data visualisation tool, it’s your gateway to interactive, intuitive, and impactful business […]

You are working at a Data Analytics company, and in one of your projects, you need to load data from a source into a target table using Talend. However, while running the Talend Job, the data will fail to load […]